Table of Contents
Eigenvalue spectra
Once we have obtained the ground state atomic configuration, we can perform electronic structure analysis. To obtain the detail information about the eigen-energy spectra of the benzene molecule, we perform one time-step run with the fixed ground state charges (we suppose our optimized structure is stored in answer.bas file). Our fireball.in file looks like now:
  &OPTION
  basisfile = answer.bas
  nstepf = 1
  icluster = 1
  iqout = 3
  ifixcharge = 1
  dt = 0.5
  &END
  &OUTPUT
  iwrteigen = 1
  &END
Once the calculation is done, eigen.dat file appears in the working directory, which lists in ascending order all eigenvalues of molecular orbitals:
           1          36
  ------ the energy eigenvalues ----
      -20.56048    -18.37085    -18.36961    -15.07488
    -15.07199    -12.69340    -12.00502    -10.79389
    -10.27202    -10.26750     -8.72117     -8.66806
     -8.66615     -6.29214     -6.29027     -1.29656
     -1.29630      2.26245      3.42055      5.15577
      5.15896      6.56990      7.02760      7.03623
     11.08185     11.09818     11.94749     11.95269
     16.15497     17.03885     81.57499     83.17471
     83.19519     86.09707     86.11842     87.78916
Information about occupancies of individual molecular level can be written into output file, if keyword iwrtefermi is switched on. In this way energy levels of HOMO and LUMO orbitals can be identified. In our particular case we found in output file:
  ------ fermi ioccupy_k for k-point =            1
  Band n =    1 k-points: ioccupy =  1
  Band n =    2 k-points: ioccupy =  1
  Band n =    3 k-points: ioccupy =  1
  Band n =    4 k-points: ioccupy =  1
  Band n =    5 k-points: ioccupy =  1
  Band n =    6 k-points: ioccupy =  1
  Band n =    7 k-points: ioccupy =  1
  Band n =    8 k-points: ioccupy =  1
  Band n =    9 k-points: ioccupy =  1
  Band n =   10 k-points: ioccupy =  1
  Band n =   11 k-points: ioccupy =  1
  Band n =   12 k-points: ioccupy =  1
  Band n =   13 k-points: ioccupy =  1
  Band n =   14 k-points: ioccupy =  1
  Band n =   15 k-points: ioccupy =  1
  Band n =   16 k-points: ioccupy =  0
  Band n =   17 k-points: ioccupy =  0
  Band n =   18 k-points: ioccupy =  0
  Band n =   19 k-points: ioccupy =  0
  Band n =   20 k-points: ioccupy =  0
  Band n =   21 k-points: ioccupy =  0
  Band n =   22 k-points: ioccupy =  0
  Band n =   23 k-points: ioccupy =  0
  Band n =   24 k-points: ioccupy =  0
  Band n =   25 k-points: ioccupy =  0
  Band n =   26 k-points: ioccupy =  0
  Band n =   27 k-points: ioccupy =  0
  Band n =   28 k-points: ioccupy =  0
  Band n =   29 k-points: ioccupy =  0
  Band n =   30 k-points: ioccupy =  0
  Band n =   31 k-points: ioccupy =  0
  Band n =   32 k-points: ioccupy =  0
  Band n =   33 k-points: ioccupy =  0
  Band n =   34 k-points: ioccupy =  0
  Band n =   35 k-points: ioccupy =  0
  Band n =   36 k-points: ioccupy =  0
From the list, we can identify the last occupied molecular level (HOMO) is no. 15 and first unoccupied level (LUMO) is no. 16. Let note, the list of eigenvalues can be found in 'eigen.dat' file accounting appropriate number of levels (in ascending order).
Density Of States (DOS)
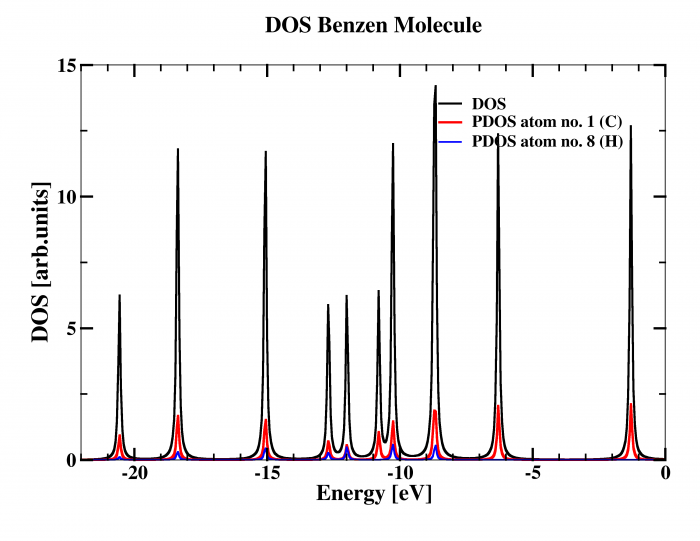
Another way how to analyze energy spectra of molecule in Fireball is to calculate Density Of State (DOS). In addition, projected DOS on each atom is provided. To run this task for particular atomic configuration, two steps are necessary:
(i) switch on 'iwrtdos' keyword in section '&OUTPUT', so 'fireball.in' looks like now:
  &OPTION
  basisfile = answer.bas
  nstepf = 1
  icluster = 1
  iqout = 1
  ifixcharge = 1
  dt = 0.5
  &END
  &OUTPUT
  iwrtdos = 1
  &END
(ii) an extra new file called dos.optional has to be created in the working directory with following syntax:
  1.0                   ! scale factor (leave 1.0)
  1       12            ! list of atoms to analyze DOS
  441                   ! number of energy steps
  -22.0   0.05          ! initial energy, energy step
  0                     ! leave untouched
  0.0     0.0           ! leave untouched
  0.05                  ! imaginary part of Green function (controls energy level smearing)
In this particular case, all 12 atoms will be involved in the DOS analysis and DOS will be calculated from energy -22.0 until 0.0 eV with energy step 0.05 eV. Several files will appear in the working directory dens_XXX.dat containing projected DOS on each atom labeled XXX and a file dens_TOT.dat including the total DOS.
Real-space electronic density
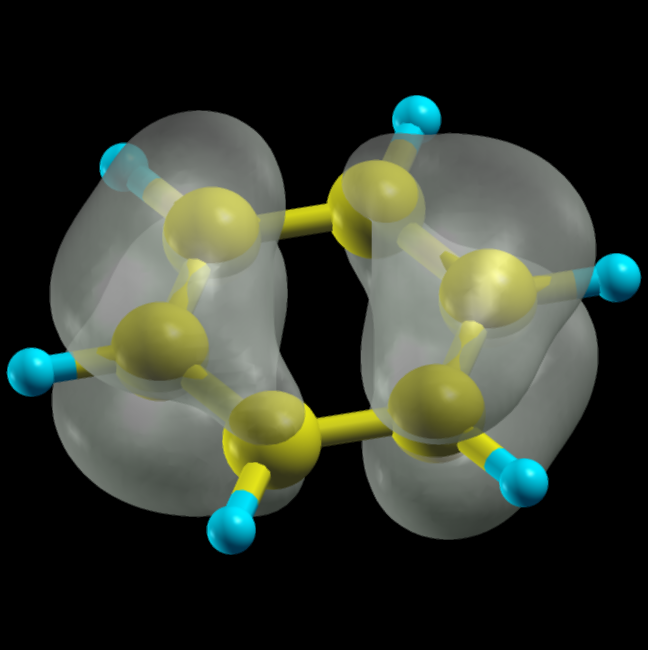
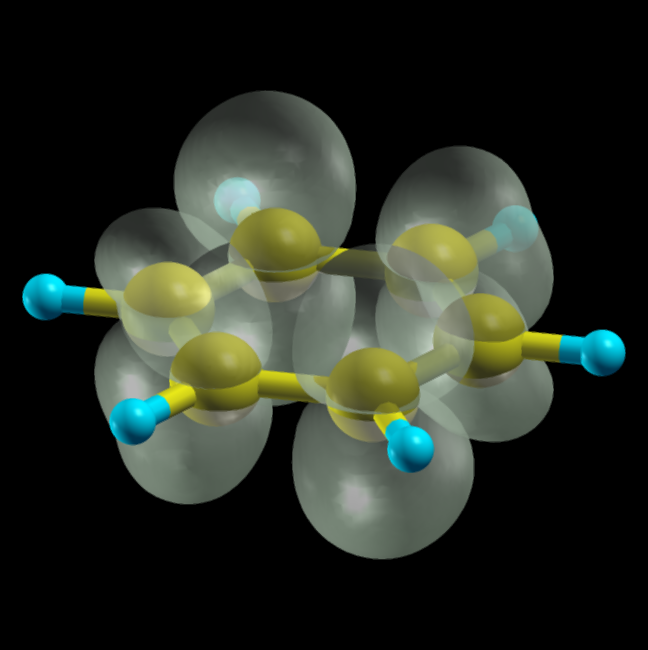
Sometimes is more illustrative to visualize the electron density in real-space. This can help as a primitive estimation of STM images or it can provide more information about spatial (de)localization certain molecular levels. Here we'll visualize HOMO and LUMO state of the molecule. To do this, we need to first switch on keyword iwrtewf in fireball.in file (the section &OUTPUT). As a next step, we need to create a new section in fireball.in called &MESH with following keywords:
  &MESH
  iewform = 1               ! individual levels listed bellow will be plotted in separated files
  npbands = 2               ! number of molecular levels to be plotted
  pbands =15,16             ! list of molecular levels to be plotted
  &END
Real-space densities of individual molecular levels are stored in bandplot_XXXX.xsf files, where XXXX means number of given molecular orbital. These files are stored in an internal format of visualization program Xcrysden.
the real-space distribution of the density of state of the HOMO molecular state
the real-space distribution of the density of state of the LUMO molecular state
  &MESH
  iewform = 2            ! sum density in energy window
  ewfewin_min = -8.16    ! lower energy bound
  ewfewin_max = -2.16    ! lower energy bound
  &END


