This is an old revision of the document!
The band structure
To obtain the band structure of Si bulk of given lattice parameter we have to perform two steps.
First, we need to achieve SCF solution. Therefore, we run a standard bulk calculation as described in the previous chapter. Let's calculate the band structure
for the lattice parameter alat = 5.5 Å, than we have the fireball.in file containing:
&OPTION
basisfile = Si.bas
lvsfile = Si.lvs
kptpreference = Si.kpts
nstepf = 1
rescal = 5.5
&END
where Si.bas, Si.lvs and Si.kpts files are identical as those used in previous chapter.
Once we obtain the SCF solution, we can determine the Fermi level from an output file:
mac135> grep "Fermi Level" $output_file | tail -1
 Fermi Level =   -4.33045968490834
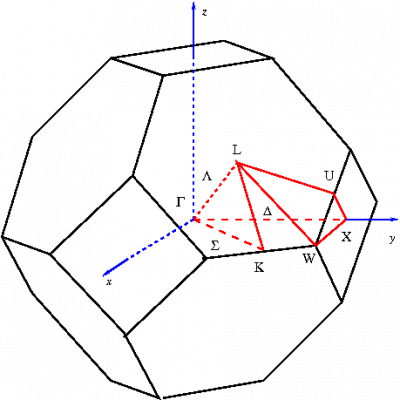
In next step, we run the FIREBALL code again, but now with fixed charges (ifixcharge = 1) and with a new set of k-points in desired high-symmetry directions in the first Brillouin zone. Remember we need having CHARGES file in a working directory for a restart. In this particular case,we have chosen a direction L-Γ-X-Γ stored in a lgxg.kpts file (see also fig. 1).
In addition, we have to write out a list of eigenvalues at each k-point switching on iwrteigen variable. Our input file fireball.in has following form now:
&OPTION
basisfile = Si.bas
lvsfile = Si.lvs
kptpreference = lgxg.kpts
nstepf = 1
ifixcharge = 1
rescal = 5.5
&END
&OUTPUT
iwrteigen = 1
&END
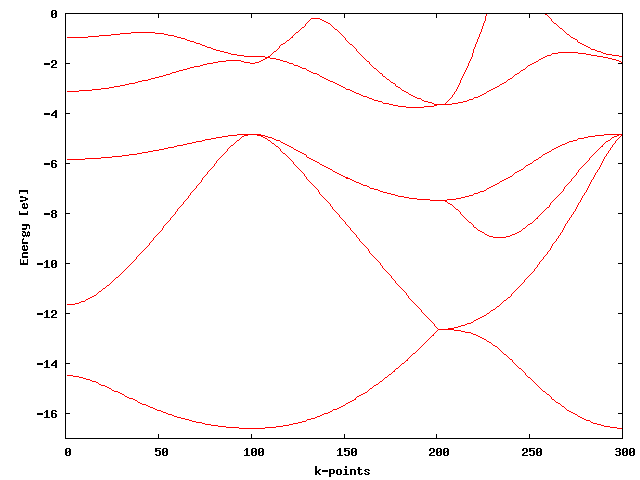
After the run, we obtain a file ek.dat appears in a working directory. This file contains at each line set of eigenvalues for given k-points ordered in ascending form. The Fermi level can
Now we have all information to plot the band structure of the Si bulk.
mac135> gnuplot
gnuplot> set xrange [0:300]
gnuplot> set yrange [-17:0]
gnuplot> set xlabel "k-points"
gnuplot> set ylabel "Energy [eV]"
gnuplot> set nokey
gnuplot> set multiplot
multiplot> plot "ek.dat" using 1:2 with lines
multiplot> plot "ek.dat" using 1:3 with lines
multiplot> plot "ek.dat" using 1:4 with lines
multiplot> plot "ek.dat" using 1:5 with lines
multiplot> plot "ek.dat" using 1:6 with lines
multiplot> plot "ek.dat" using 1:7 with lines


